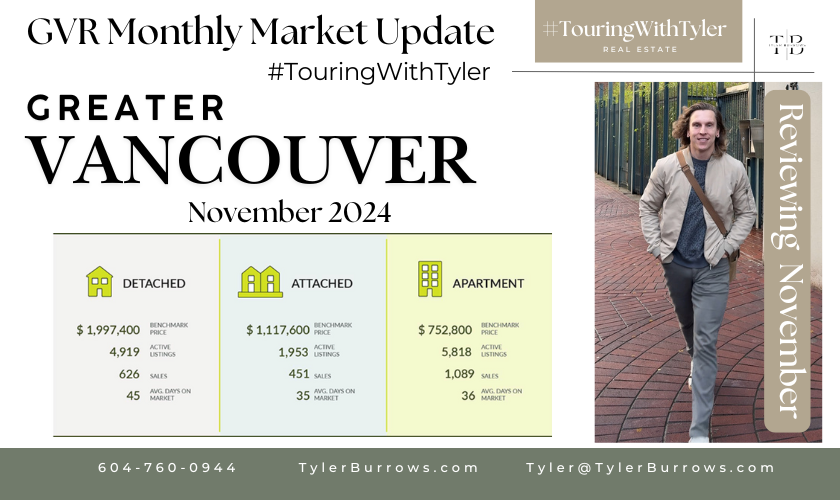
The Greater Vancouver real estate market is heating up as we head toward the end of the year. November 2024 brought a surge in homebuyer activity, marking a 28% increase in sales compared to November 2023, with 2,181 residential properties sold. While this impressive uptick still falls 12.8% below the 10-year seasonal average, it reflects consistent momentum following October’s 30% year-over-year rise in sales.
What’s Happening with Listings?
New listings also saw growth, with 3,725 properties added to the market—up 10.6% from last year and exceeding the 10-year seasonal average by 5.4%. Total active listings in November stood at 13,245, marking a 21.2% year-over-year increase and a substantial 26.1% above the 10-year seasonal average.
This increase in listings has maintained balance in the market, keeping price growth steady across all property types. However, experts suggest that continued demand growth without a proportional rise in listings could lead to upward price pressure in the New Year.
Sales-to-Active Listings Ratios
The sales-to-active listings ratio, a key indicator of market conditions, was at 17.1% in November. Broken down by property type:
Detached homes: 12.7%
Attached homes: 23.1%
Apartments: 18.7%
For context, downward price pressure typically occurs when this ratio is below 12% for an extended period, while ratios above 20% often signal upward pressure on prices.
Home Prices: A Steady Market
The benchmark price for all residential properties in Metro Vancouver was $1,172,100, a slight 0.9% decrease from November 2023 and almost unchanged from October 2024.
Detached homes had a benchmark price of $1,997,400, showing a 1% annual increase.
Apartments stood at $752,800, with a modest 1.2% decrease year-over-year.
Attached homes saw the most notable growth, with a benchmark price of $1,117,600, up 1.8% annually.
What Does This Mean for Buyers?
With increased listings and balanced market conditions, now could be a great time to explore your options in Greater Vancouver. Whether you’re a first-time buyer or looking to make your next move, this relatively stable market offers opportunities to find a home that fits your needs and budget.
Have Questions? Let’s Chat!
Navigating Vancouver’s competitive real estate market can be overwhelming, but you don’t have to do it alone. If you’re curious about buying your first home or need guidance on finding the perfect property, feel free to reach out! I’m here to answer any questions and help you achieve your homeownership goals.
For more insights, home tours, and updates, follow me on social media— #TouringWithTyler is where the magic happens. See you there!


